

Making Forecasting Scores Easier to Interpret: Introducing the Brier Index
A simple transformation that makes the Brier Score intuitive

(Post written by Simas Kučinskas, Houtan Bastani, and Matt Reynolds)
TL;DR: The Brier score is hard to interpret because its units are squared probabilities. The Brier Index, defined as (1 − √Brier score) × 100%, fixes this problem, giving a 0–100% scale where 50% = always predicting 50% and 100% = perfect foresight. On ForecastBench, superforecasters score 70.6% and the best LLMs (CassiAI’s ensemble_2_crowdadj and xAI’s Grok 4.20, Preview) score 67.9%. We’ve adopted the Brier Index as the primary metric on the ForecastBench leaderboard.
To evaluate forecasting accuracy, we typically use the Brier score.1
The Brier score has many desirable features. Most importantly, it’s strictly proper, meaning that to achieve the highest possible score, it’s optimal to report your true probability forecast (i.e., it’s not optimal to lie).2
However, the Brier score has a major drawback: it’s difficult to interpret and communicate.
In this post, we untangle the problem, propose a simple metric—the Brier Index—that fixes it, and show what the solution looks like in practice on ForecastBench, our AI forecasting benchmark.
1. Why Brier Scores Are Confusing
Currently, superforecasters—highly accurate forecasters identified through prior geopolitical forecasting tournaments—lead the ForecastBench leaderboard with a Brier score of 0.086. The best LLMs, CassiAI’s ensemble_2_crowdadj and xAI’s Grok 4.20 (Preview), sit at #2 with 0.103.
Two natural questions arise:
What does a Brier score of 0.086 mean? Are the superforecasters highly accurate? Are they not that great?
How large is the difference between 0.086 (superforecasters) and 0.103 (best LLMs)? Is the 0.017 Brier-score gap “large” or “small”?
Both questions are difficult to answer because the Brier score has uninterpretable units. The Brier score is the mean squared error (MSE) for binary events: if f is your forecast and o is the outcome (either 0 or 1), then the Brier score is given by b = (f − o)². Averaged over N predictions, you get the mean Brier score.
The issue is the same one that plagues MSE generally: the units are squared. A Brier score of 0.086 means “0.086 squared probability units from the truth.”
Confused? You’re not alone.
2. A More Interpretable Metric: The Brier Index
Step 1: Take the Square Root
The first fix is straightforward: take the square root of the Brier score to recover the natural units (i.e., calculate the root mean squared error, RMSE). This is analogous to converting variance (hard to interpret) into a standard deviation (same units as the data).
The square root of the superforecasters’ Brier score is √0.086 ≈ 0.29. But what does an RMSE of 0.29 mean, precisely?
It’s tempting to say “on average, superforecasters are 0.29 probability units away from the truth.” Unfortunately, that’s not quite right. This interpretation is correct for the mean absolute error (MAE) but not RMSE.34
The precise interpretation of RMSE is slightly more indirect: an RMSE of 0.29 means that a hypothetical forecaster who always predicts 29% on questions that resolve to 0, and always predicts 71% on questions that resolve to 1, would achieve this exact same score.5 That’s a simplification: real forecasters don’t make constant-magnitude errors on every question. However, it provides a useful reference point.
Step 2: Flip the Scale
Taking the square root solves the “squared units” problem. However, as with the Brier score, lower values are better for RMSE. In our experience, decision-makers find this counterintuitive; for most metrics decision-makers encounter, a higher score indicates a better result.
Our proposal—the Brier Index—is defined as:
Brier Index = (1 − √Brier score) × 100%
The scale works as follows:
100%: perfect foresight (assigning probability 1 to events that happen and 0 to events that don’t).
50%: equivalent to always predicting 50%.
0%: maximally wrong (assigning probability 1 to events that don’t happen and 0 to events that do).
We can also connect the Brier Index back to the hypothetical forecaster interpretation from Step 1. The superforecasters’ Brier score of 0.086 corresponds to a Brier Index of 70.6%. This is the same score achieved by a hypothetical forecaster who predicts 70.6% on events that resolve to 1, and 29.4% on events that resolve to 0.
An important caveat: Brier Index is not a “percentage-correct” metric. A Brier Index of 70.6% does not mean the forecaster “got 70.6% of questions right.” Instead, it measures how far probability forecasts are from the truth, rescaled to a 0–100% range. For example, a forecaster who predicts 51% on events that happen and 49% on events that don’t would get the direction right every time, yielding a high percentage correct but a mediocre Brier Index (just 51%).
Because the Brier Index is a monotonic transformation of the Brier score, it is also strictly proper: a forecaster still maximizes their expected Brier Index by reporting their true beliefs.
3. Brier Index on ForecastBench
Let’s return to our motivating questions.
Applying the Brier Index to ForecastBench:
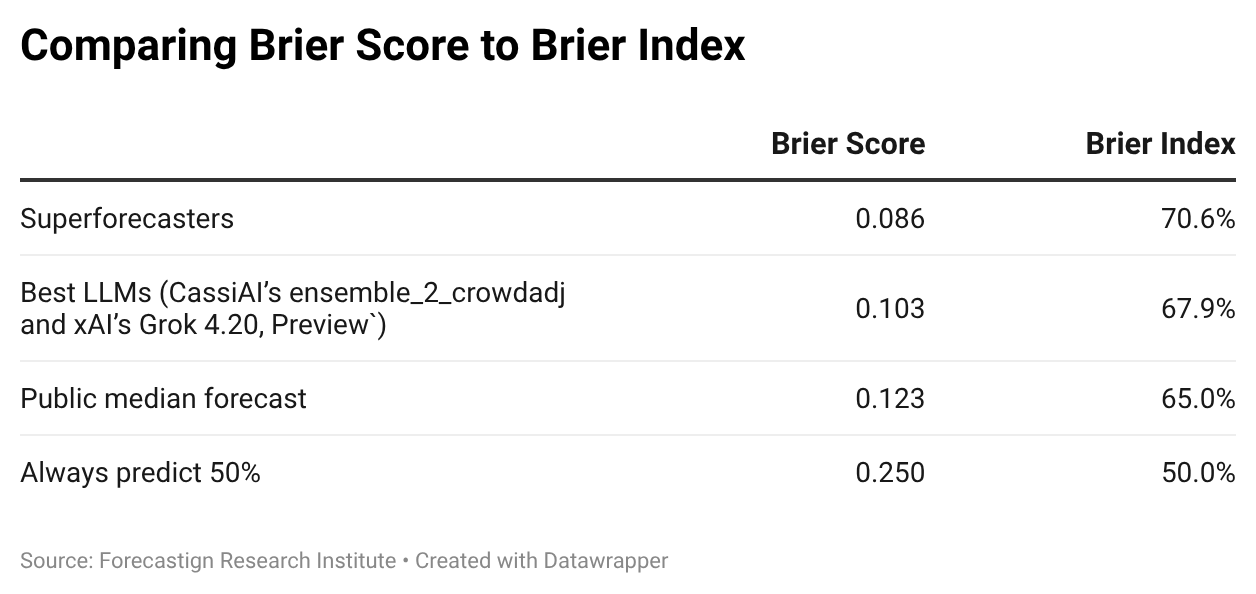
Superforecasters achieve a Brier Index of 70.6%, and the gap to the best LLM is 2.7 percentage points.
Now, how large is that 2.7 percentage point gap?
One way to put this in context is to look at the progress of state-of-the-art (SOTA) LLM forecasting performance:
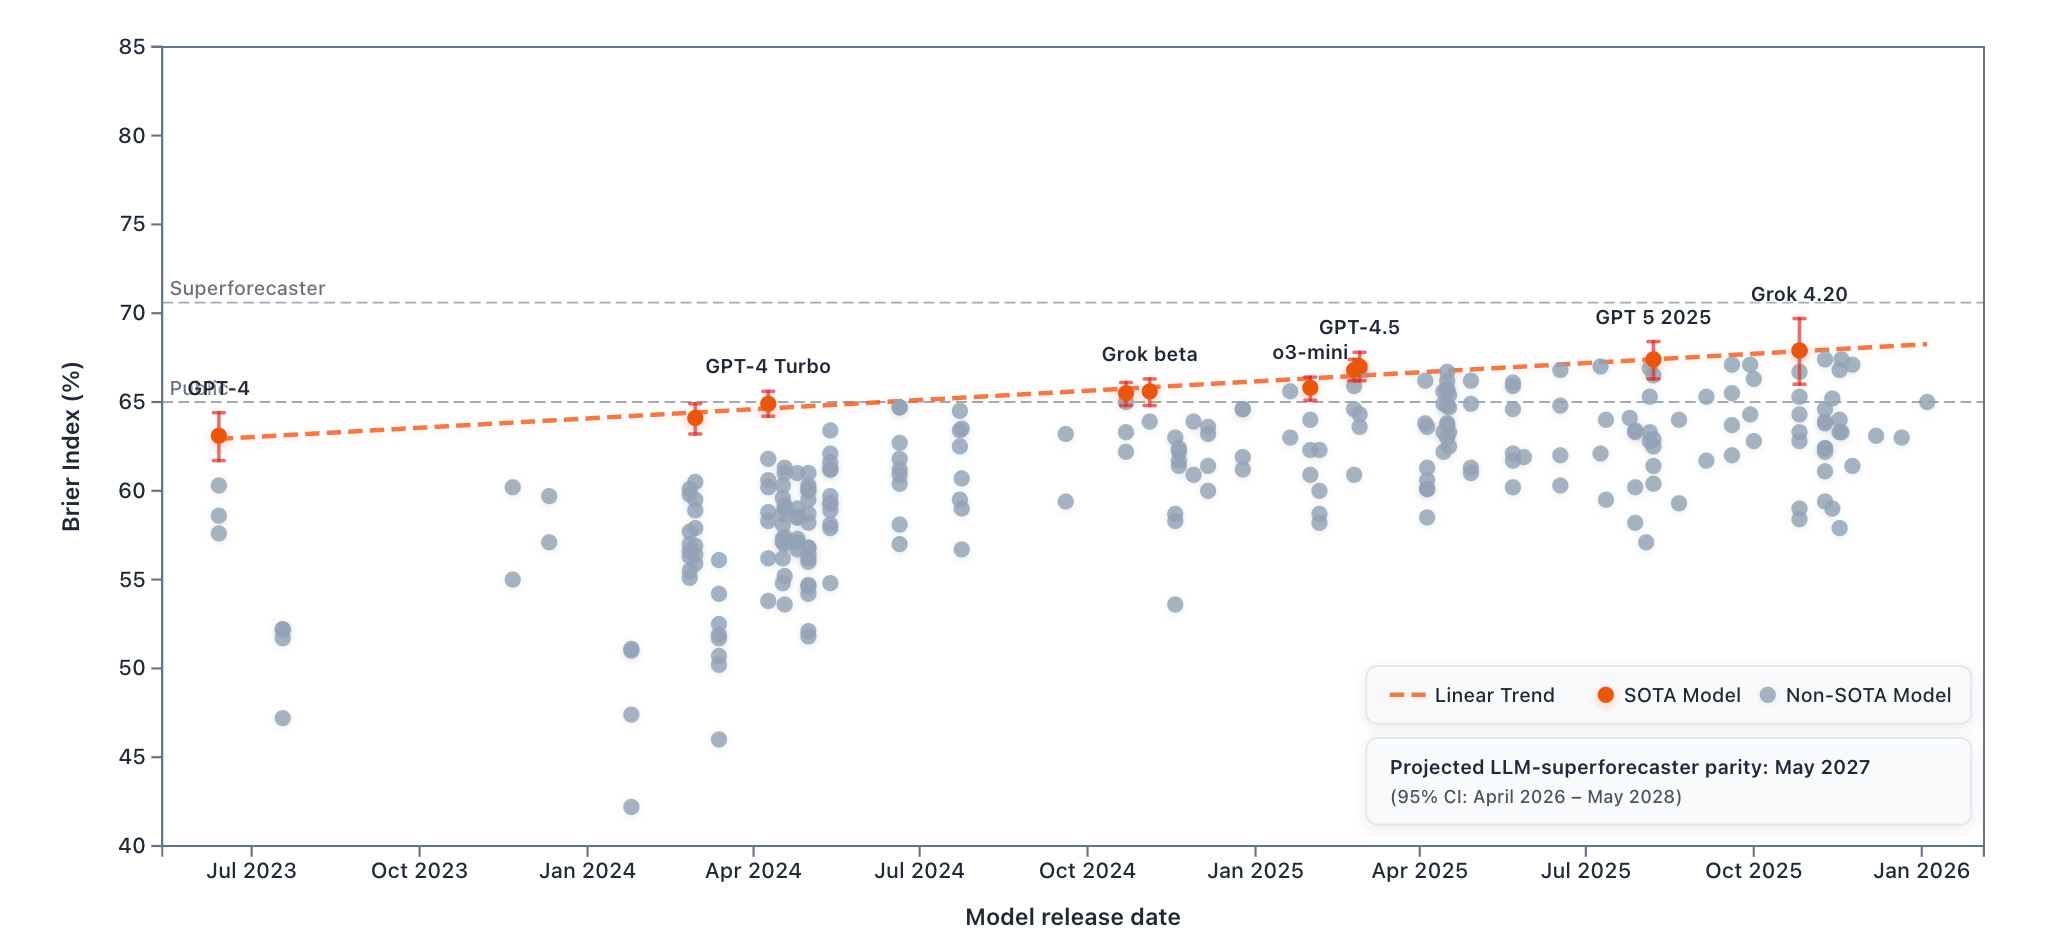
From Claude 3.5 Sonnet (October 2024) to Grok 4.20 (Preview, October 2025), the Brier Index increased by 2.4 percentage points in one year. The current gap between superforecasters and the best LLMs represents a little over one year of LLM progress. That gap is substantial, but if the current rate of LLM progress continues, LLMs may reach superforecaster-level performance relatively soon.
Switching from Brier score to Brier Index shifts the extrapolated LLM–superforecaster parity date slightly:
Extrapolated Brier score parity (previous): March 2027 (95% CI: February 2026 – January 2028).
Extrapolated Brier Index parity (updated): May 2027 (95% CI: April 2026 – May 2028).
This shift is a modeling artifact of how we extrapolate trends. In both cases, we extrapolate the parity date by fitting a linear trend over time. But a straight-line trend is not preserved under nonlinear transformations. Because the Brier Index is a monotone, convex transformation of the Brier score, the same absolute improvement in Brier score translates into a progressively larger increase in Brier Index at high accuracy levels:
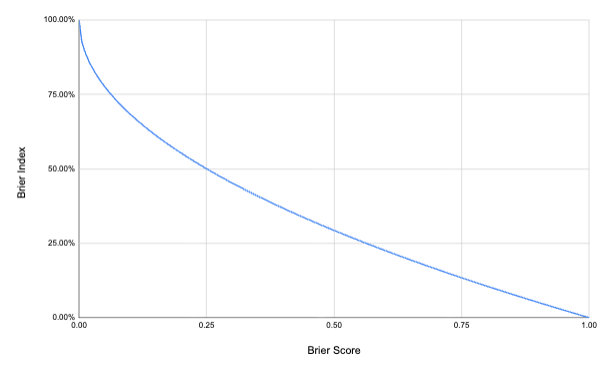
Hence, a trajectory that looks linear in Brier score will generally look curved (accelerating) in Brier Index. While the leaderboard ranking is unchanged by the transformation, the intersection point implied by a simple linear extrapolation—and thus the parity date—shifts slightly.
A note on the extrapolation: These trend lines are fitted to a small number of SOTA models over roughly two years of data. The 95% confidence intervals reflect uncertainty in the linear fit, not uncertainty about whether LLM progress will in fact remain linear. We currently don’t have strong evidence that progress is “more linear” in Brier score than in Brier Index (or vice versa). For this reason, we keep the extrapolation deliberately simple and report parity under the same linear-trend approach as previously, using the Brier Index as our primary, more interpretable metric.
4. Updating the ForecastBench Leaderboard
We’ve adopted the Brier Index as the primary metric on the ForecastBench leaderboard. This change doesn’t affect the rankings. The Brier Index is a monotonic transformation of the Brier score, so the ordering is identical. However, we expect that the headline number will be easier to understand. We have also updated the linear trend extrapolation graph on the “Explore” page. The underlying Brier scores remain available on the "Datasets" page.
We use the Brier score for binary questions, that is, questions that resolve to either zero or one such as “Will it rain tomorrow?”. All ForecastBench Brier scores reported here use a difficulty adjustment; see the original ForecastBench launch post for details. For brevity, we write “Brier score” throughout, even when the score is difficulty-adjusted.
Under improper scoring rules, a forecaster’s optimal strategy is to report something other than their true belief. For example, under linear scoring (where your score equals the probability you assigned to the actual outcome), the optimal strategy is to always predict 0% or 100%.
MAE is not a proper scoring rule for binary events. To see why, consider a binary outcome o ∈ {0, 1} that occurs with true probability p. The expected MAE for a forecast f is E[|f − o|] = p|1 - f| + (1 − p)|f| = p + f(1 − 2p). This is linear in f, so the optimal forecast is f = 0 when p < ½, f = 1 when p > ½, and any f ∈ [0, 1] when p = ½. In other words, MAE incentivizes reporting the median of the outcome distribution (i.e., an extreme 0 or 1 forecast), not the true probability p.
MSE also provides an upper bound on the MAE. Since (f − o)² is convex in (f − o), the finite form of Jensen’s inequality gives us (1/N Σ|fᵢ − oᵢ|)² ≤ 1/N Σ(fᵢ − oᵢ)², i.e., MAE² ≤ Brier, hence MAE ≤ √Brier. This holds deterministically for any realized sample of forecasts. So while √Brier is not literally “the average distance from truth,” it is an upper bound on it.
If the hypothetical forecaster predicts x on events that resolve to 0 and (1 − x) on events that resolve to 1, their Brier score on every question is x2. Hence, RMSE = x. This holds irrespective of the probability that the event resolves to 1.
Nice idea! But a mall question: is the Brier Index still strictly proper? My understanding is that propriety is preserved under positive affine transformations, but not necessarily under arbitrary monotonic ones? E.g. for n = 1, the BI reduces to 100(1 − |f−o|)(absolute error), which is generally not strictly proper. I might be missing something about the aggregation though.
https://en.wikipedia.org/wiki/Scoring_rule#Affine_transformation
https://stats.stackexchange.com/questions/145875/alternative-notions-to-that-of-proper-scoring-rules-and-using-scoring-rules-to